The Jamf Protect Dashboard
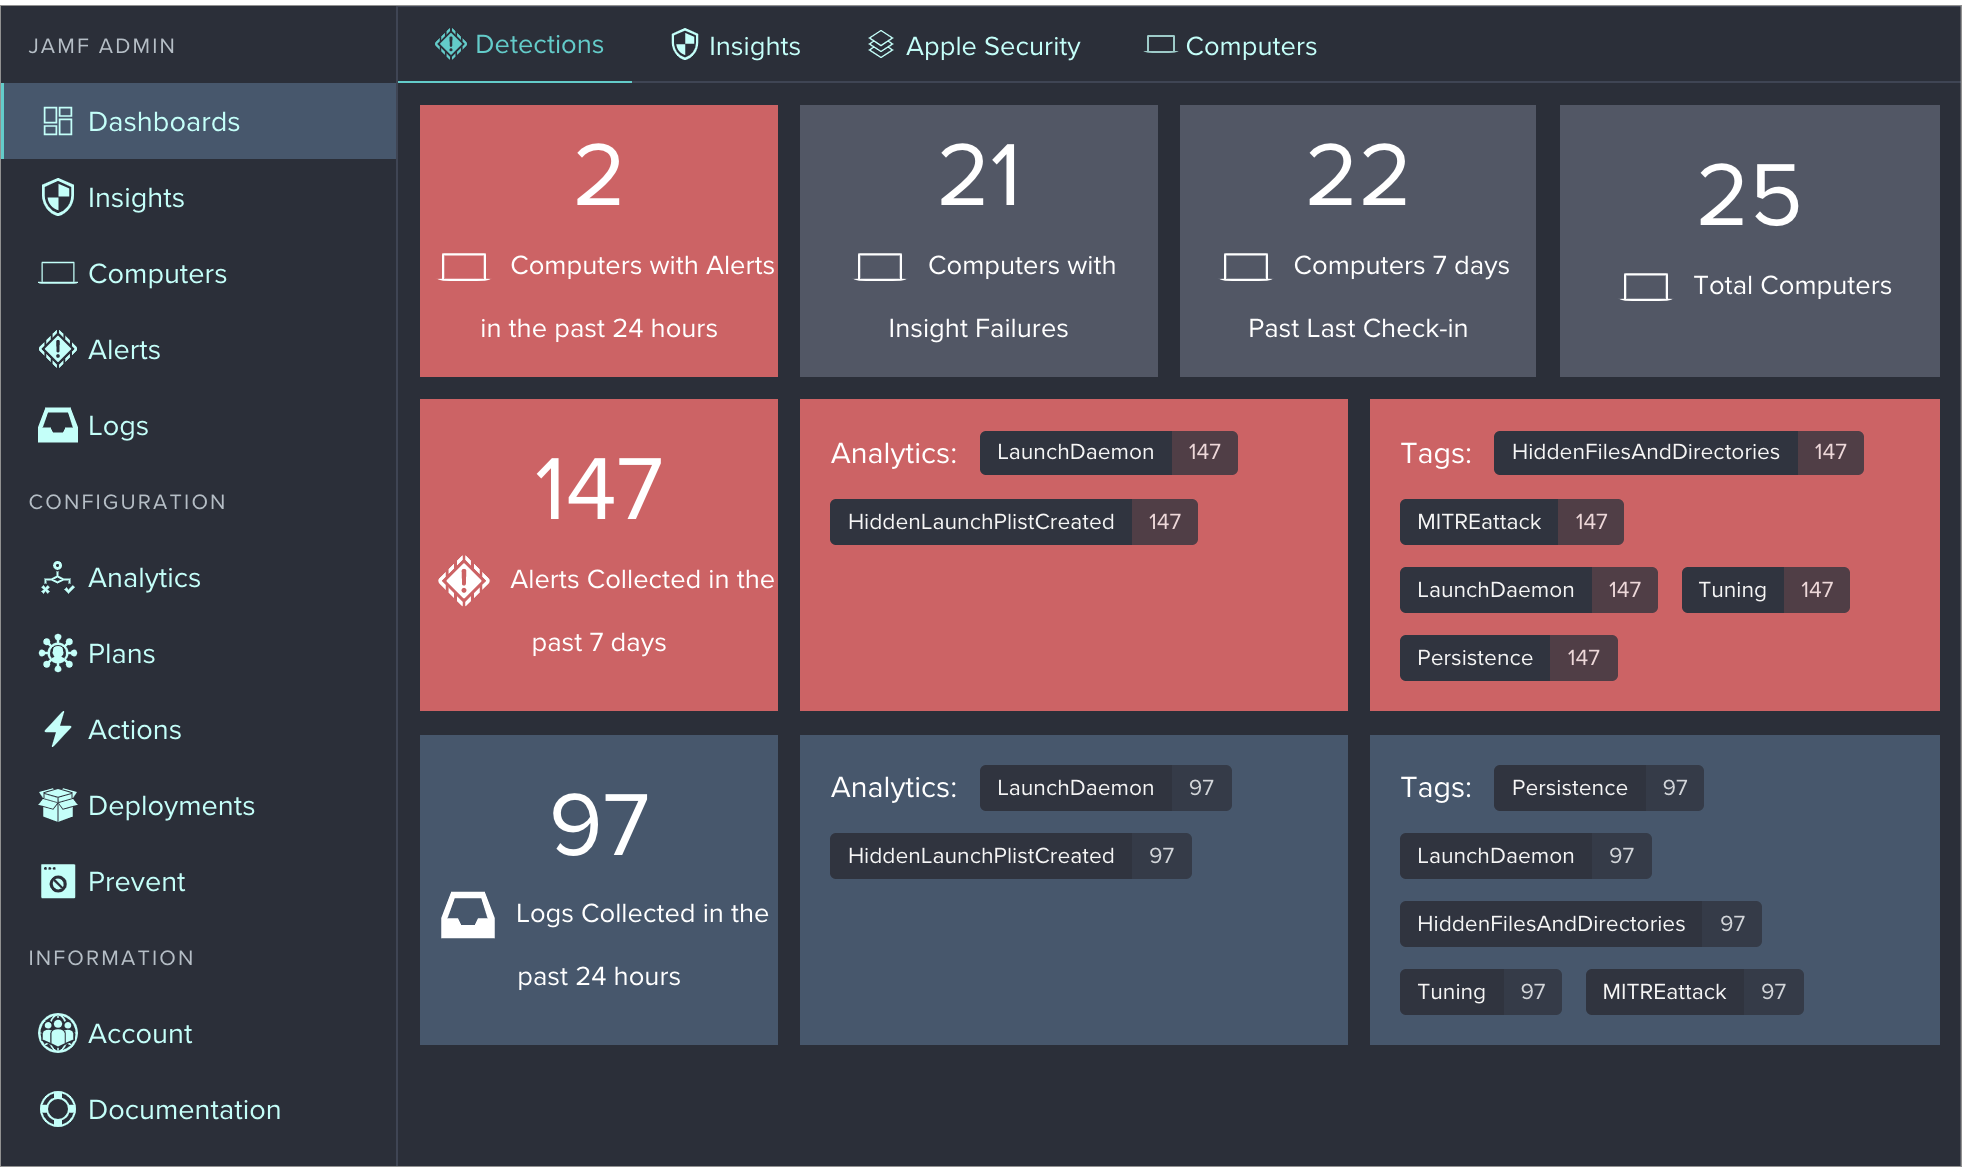
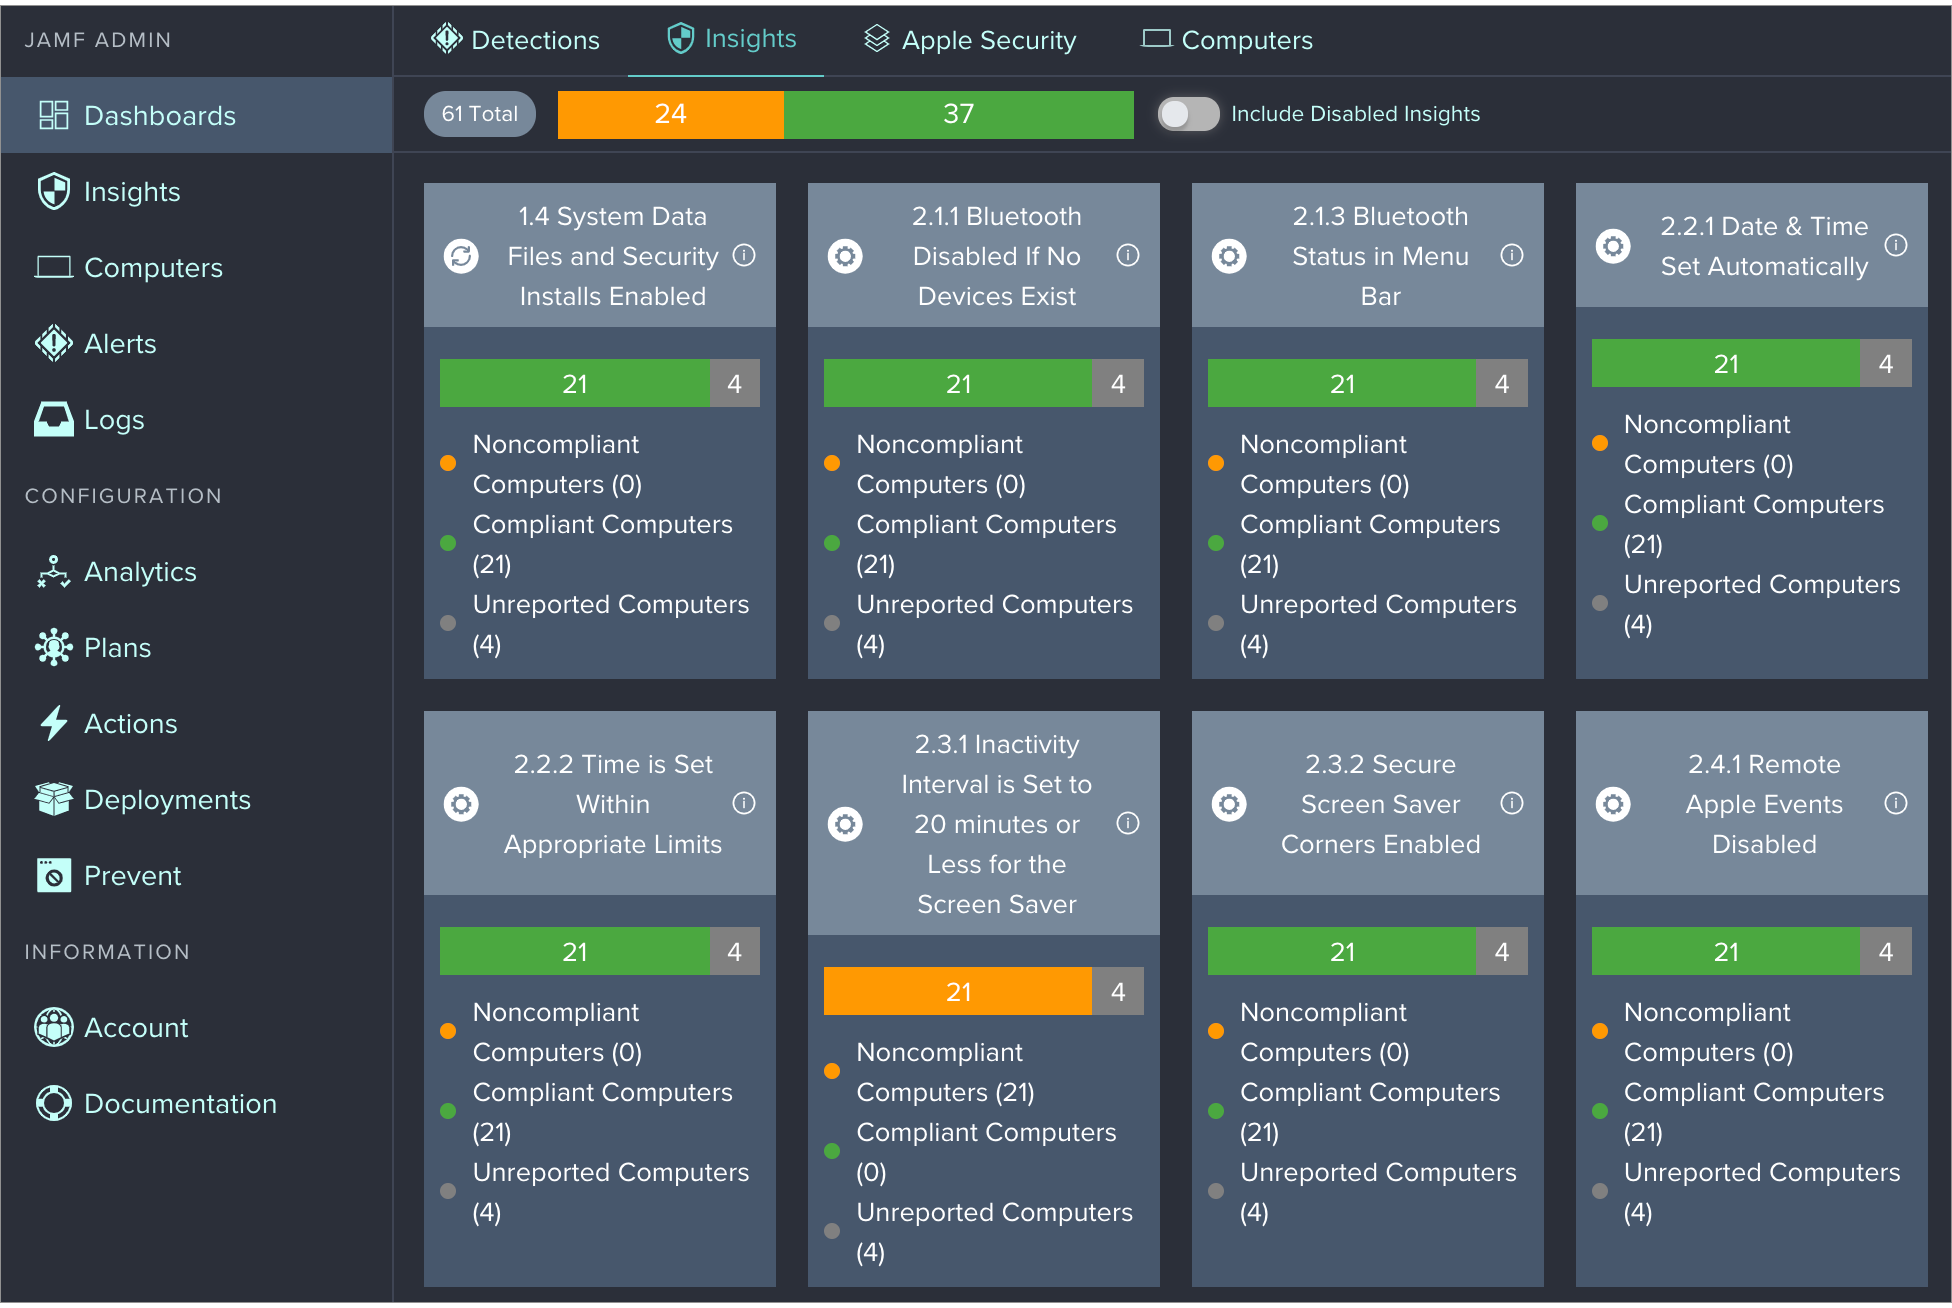
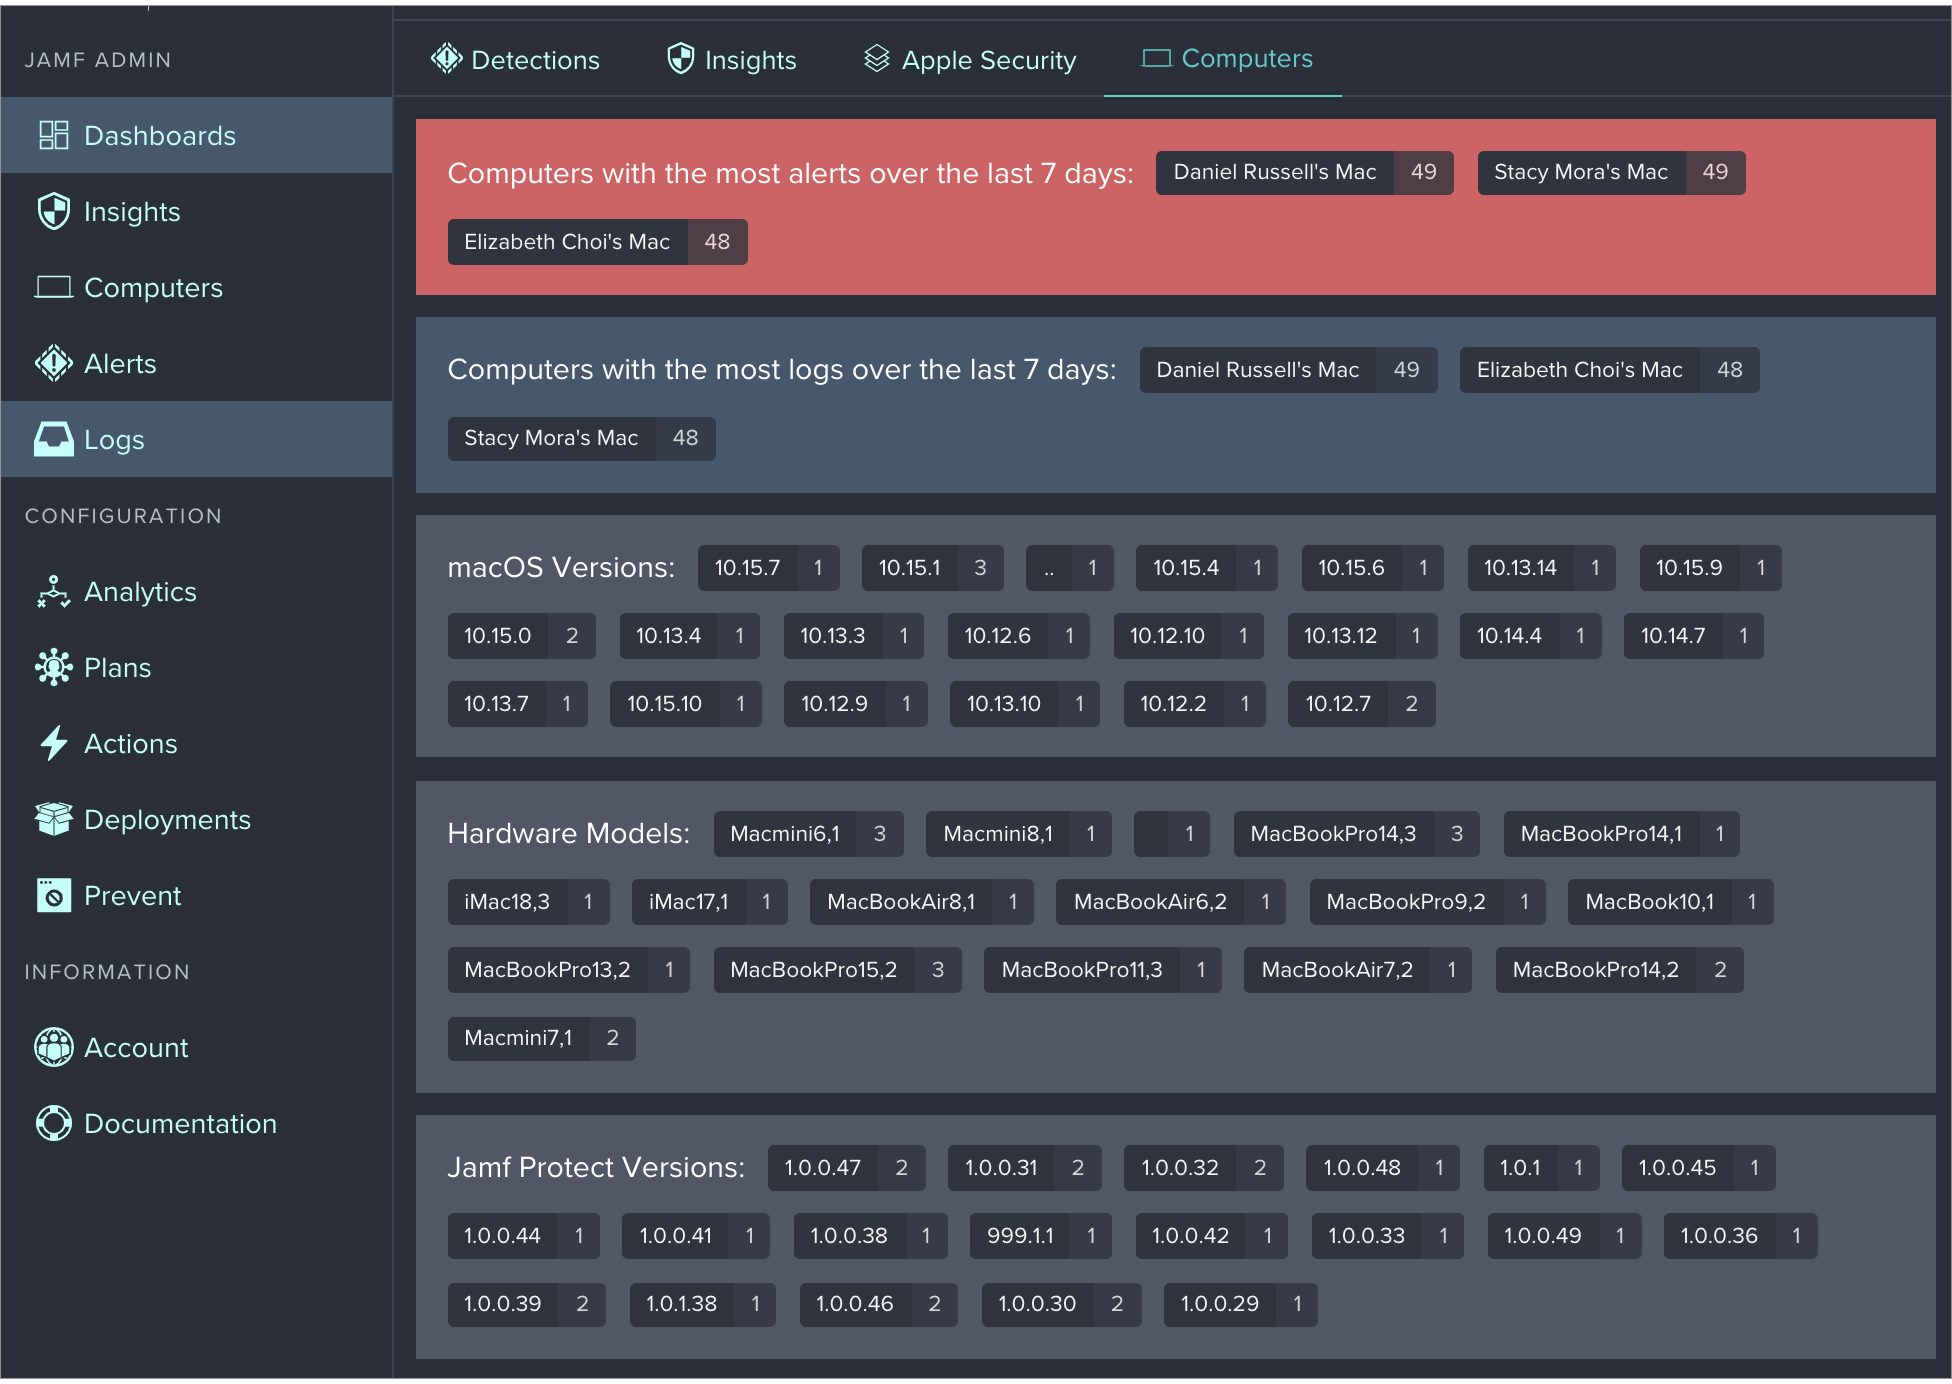
The Jamf Protect dashboard provides an overview of collected data from computers. The following panes are available in the Dashboards tab:
-
Detections
-
Insights
-
Computers
The Detections pane highlights alerts and log issues on computers and associated Analytic categories and tags. You can click on items to view more information about an alert, log, or computer.

The Insights pane highlights the how many computers are compliant and noncompliant for each Insight. You can click on any Insight to view additional information.

The Computers pane highlights key metrics about computers with the Jamf Protect agent, such as computers with the most alerts and logs, hardware models, and versions of macOS and the Jamf Protect agent on computers. You can click any metric for more information.

Related Information
For related information, see the following sections of this guide:
-
Viewing Collected Data
Find out how to view collected data from computers.
-
Viewing and Managing Computers
Find out how to view collected data from a single computer and manage a computer's Jamf Protect Plan.